IMPROVE Your NABERS Rating
NABERS is a national rating system which measures and rates buildings, tenancies, and homes environmental performance compared to similar buildings. Optimise your building performance to save your buildings more energy, reduce waste and become more water efficient.
Turn data into insights and results
Connecting buildings, spaces, humans, all in one place
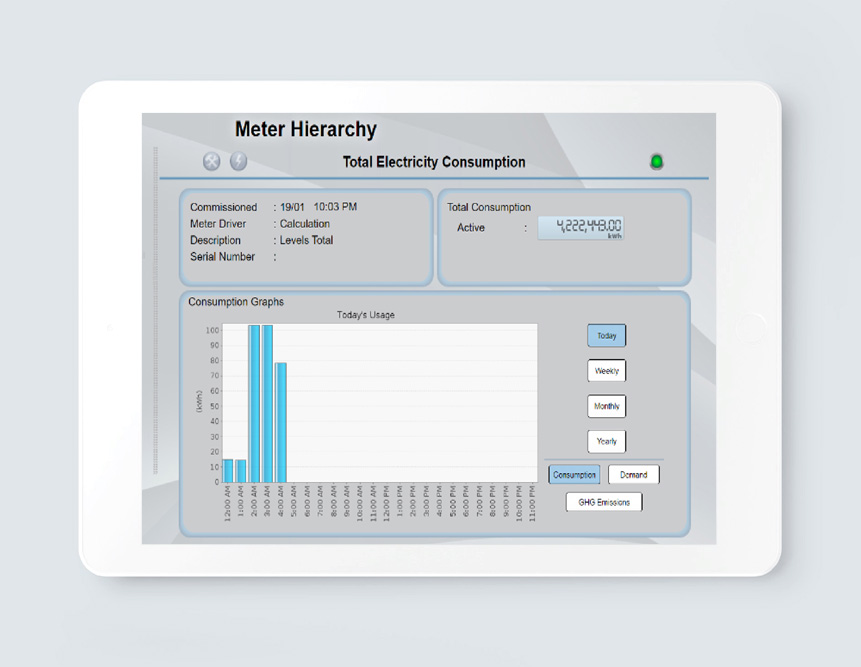
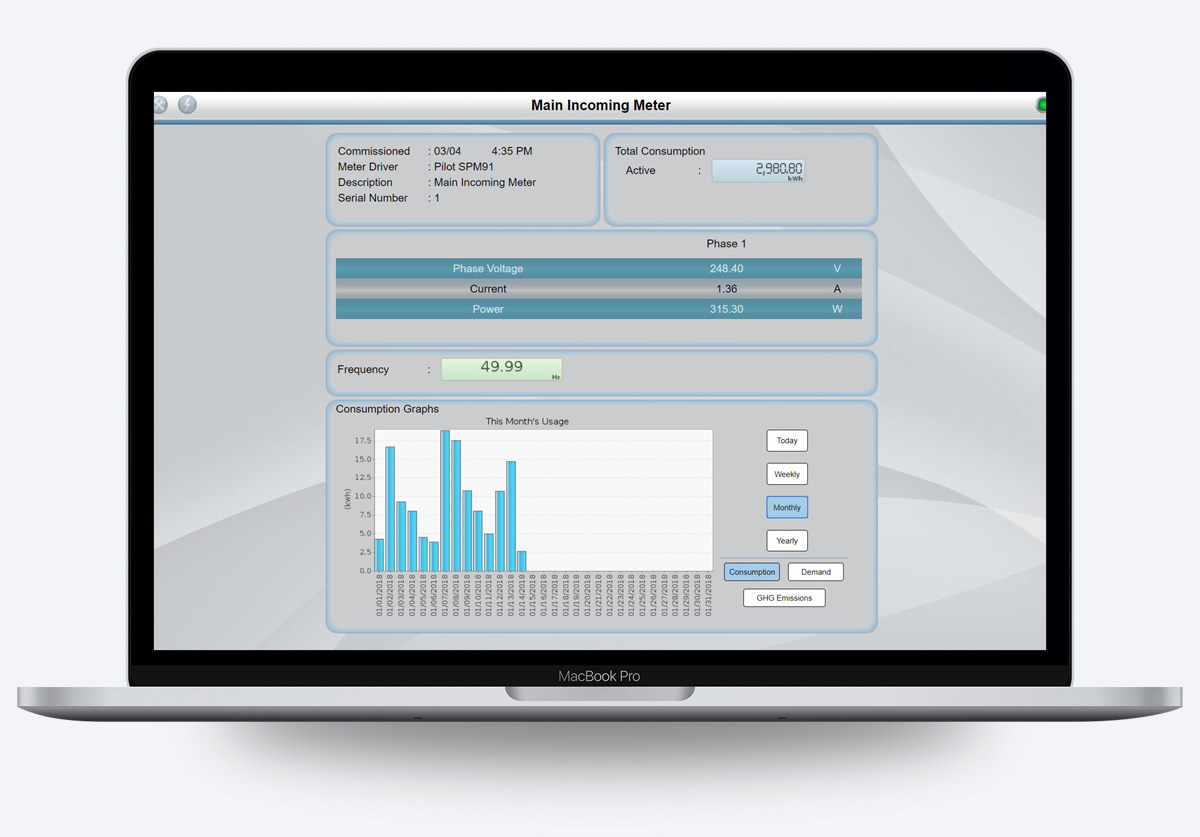
Visualise and report utility and meter data in real time
Unlock performance opportunities to capture energy savings, reduce energy consumption and improve your buildings sustainability.
Electricity / Gas / Thermal / Diesel / Waste
Energy Management Systems
Visually appealing real-time reporting system displays all utility performances in a building.
Building Management Systems
We create building automation software that can be used to monitor and control equipment and operations.
Automated Tenant Utility Billing
Automatically generate any utility billing content for all your tenants, as well as the ability to charge for after hour usage.
Energy in Control
View Whitepaper
We create energy management and building automation products for a healthier and more productive workplace.
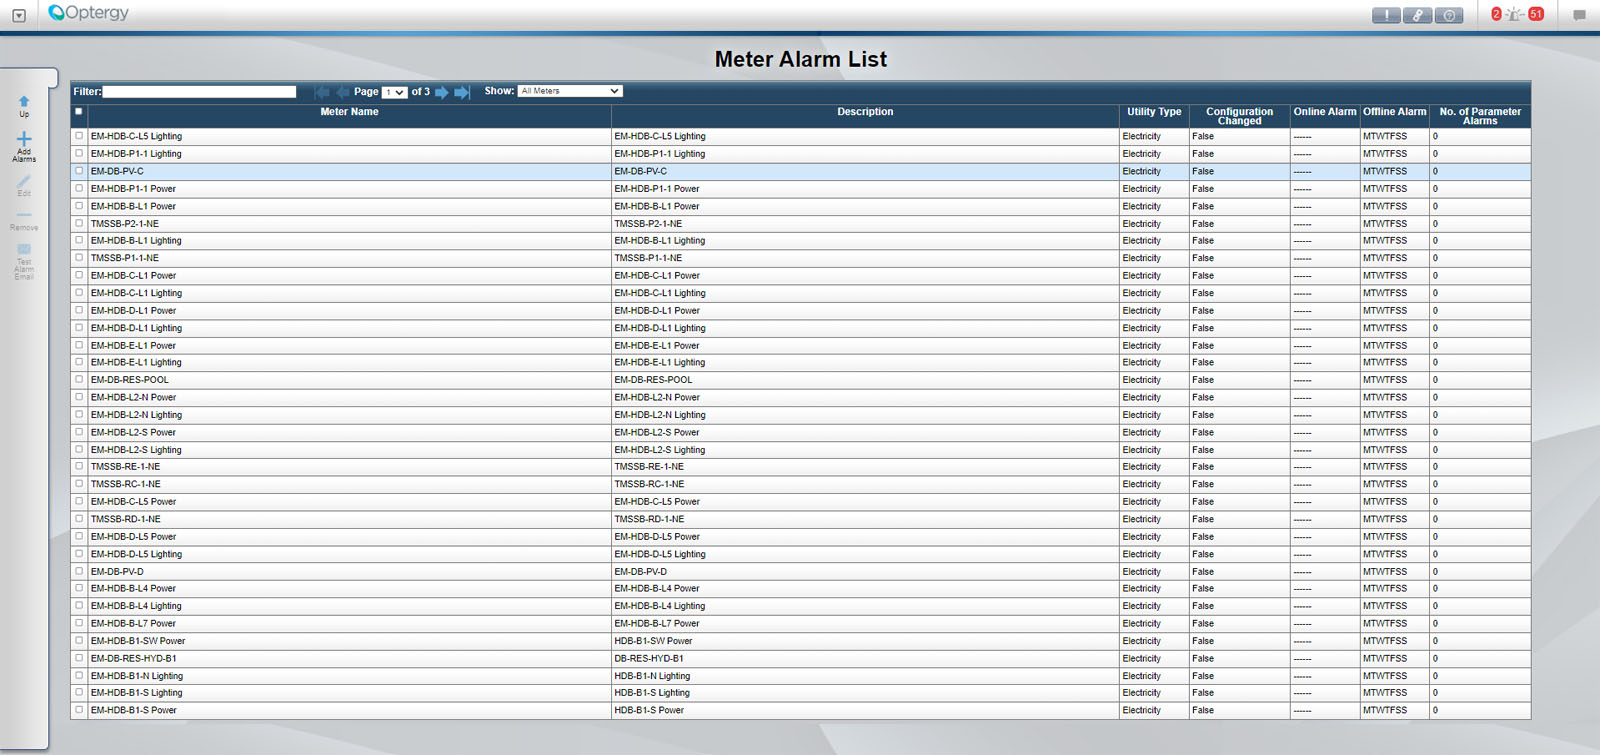
Meter Alert
Optergy software allows users to configure alarms for meters alerts
Stay in the know
Optergy software allows users to configure alarms for meters alerts. Users can be notified of new metering alarms in three ways:
1) Appear and be displayed in the Optergy software banner.
2) Received as alarm emails with URL link to the meter in alarm.
3) Notification via email or SMS.
Alarm Conditions Include
- Configuration changed.
- Meter online/offline.
- Instantaneous maximum and minimum values.
- Consumption over interval.
- Consumption over time.
- Outside tolerance levels.
Adjustable
Adjustable alarming conditions allows users to create context around the alarms being generated.
For example; if a cooling tower top meter is installed, the user can define alarms that identify unusual water consumption outside of normal operating hours. This can identify if the typical ball valve and float water top up has failed open or closed.
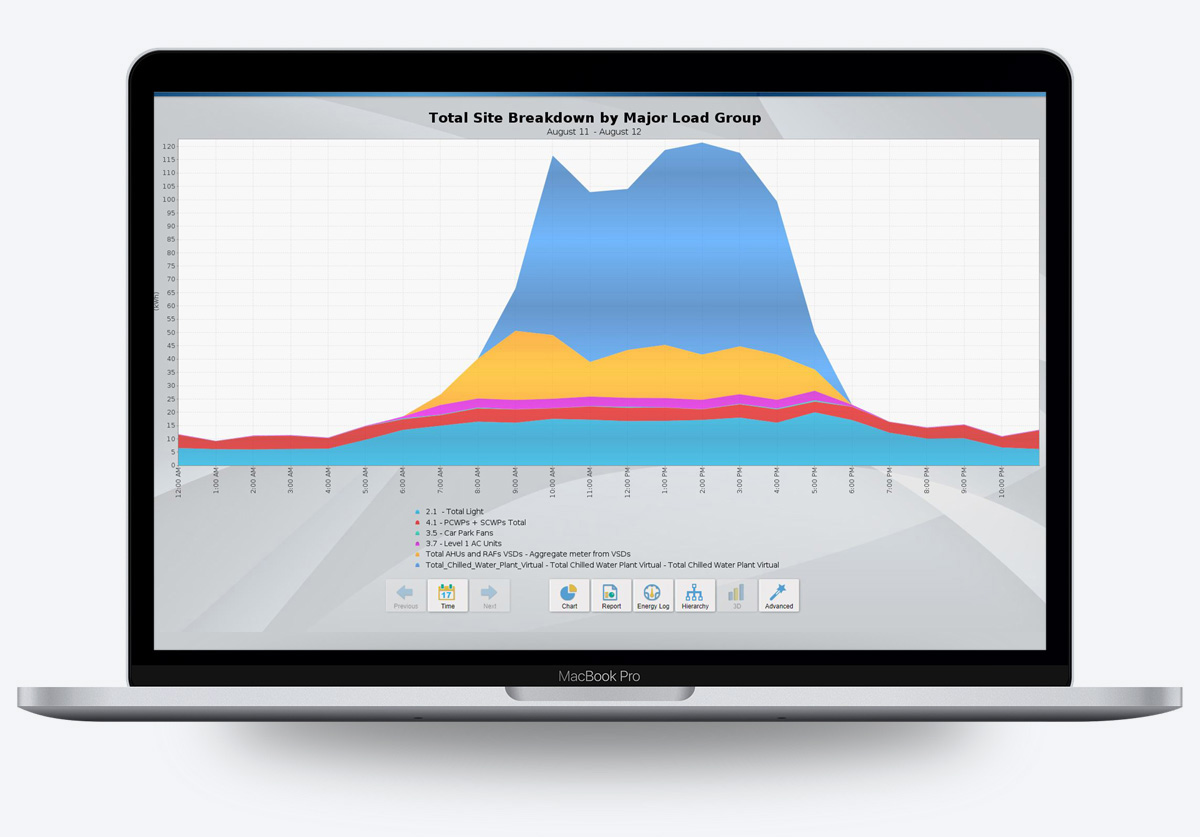
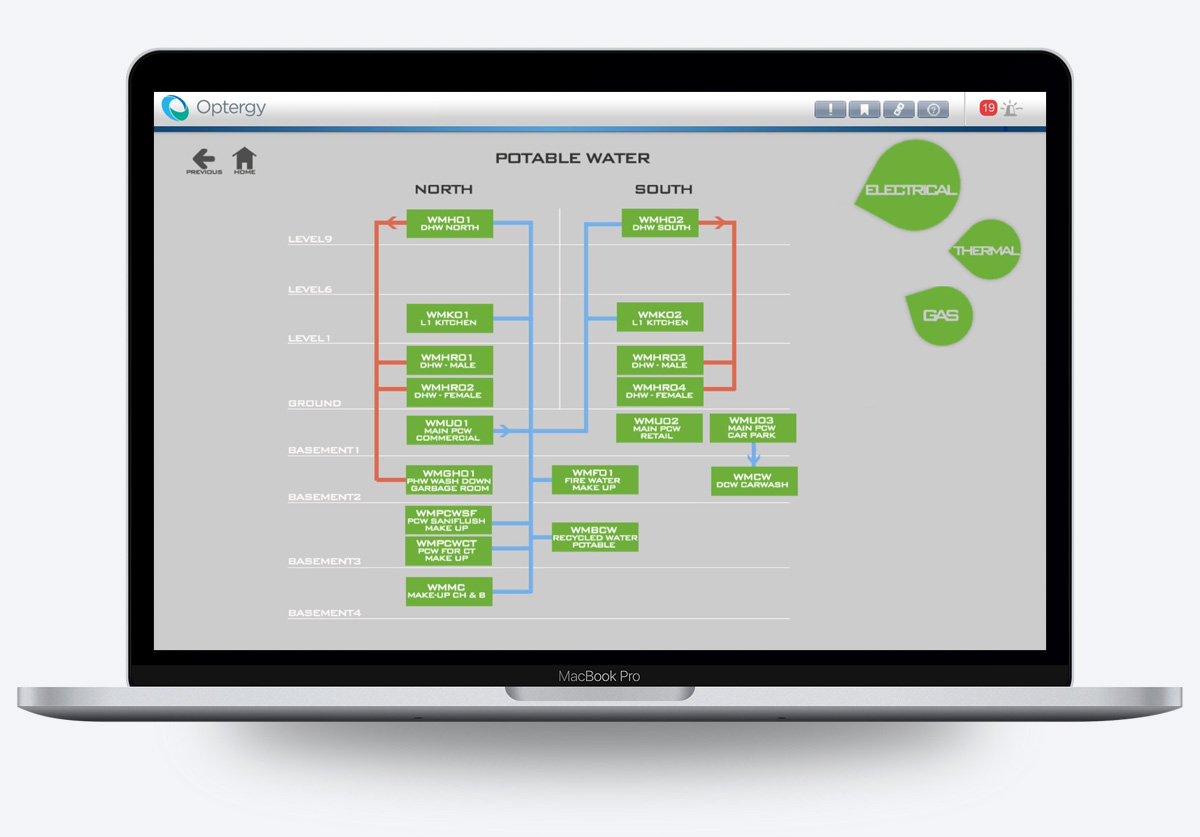
Custom Displays
Achieve your objectives
Using Optergy’s built-in display tool, users can create custom display pages to represent the flow of utilities throughout a building. This could be in the form of a single line diagram or by load group. For example; electricity can be grouped into loads such as – lighting, general power, lifts/elevators, HVAC, general fans. Water loads can be grouped into loads such as – cooling towers, toilets potable or domestic hot water.
Simple Configuration
Define, Select & Assign
Step 1
Define Meter Name
Step 2
Select Utility Type
Step 3
Define Meter Hierarchy
Step 4
Select Communication Method
Step 5
Select Meter Type Template